In the summer months as power demands go up, available voltage/power gets lower due to demand, this is especially true late mornings, in areas where A/C are being used. Understand as power/voltage drops wattage does as well all of which leads to lower heat being generated and leads roast times can grow longer. This also affects temperature readings if you happen to be using a Plus version as noted in our A/B Temperature documents
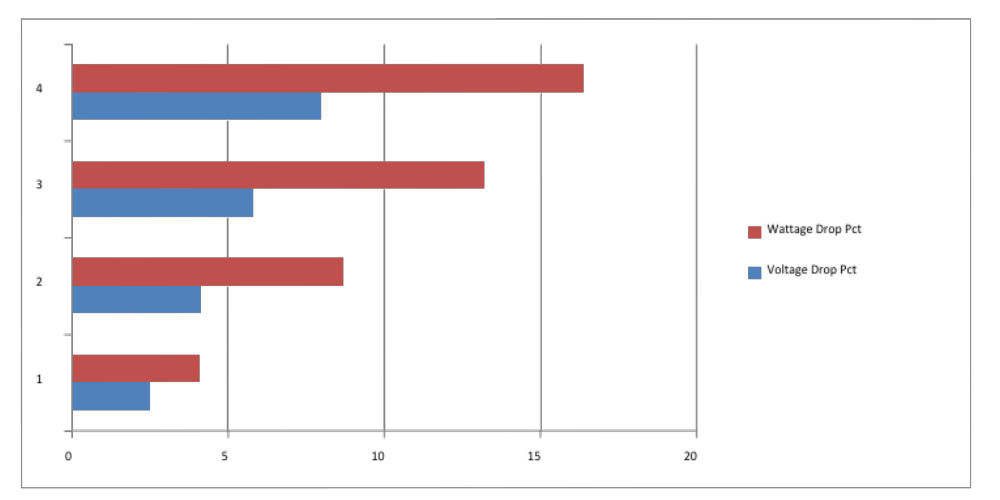
The other effect is on 2000AB systems or those with conversion kits when power drops significantly there is an audible clicking in conjunction with intermittent start stop/ light flashing all clearly indicate you are below 110v. As noted in the charts below that equates to over a 16% drop in wattage version and be like trying to run a 6 cylinder car on only 5 cylinders.
Why is that?
In short power lines are no different than pipes that carry water. They have limited supply, limited capacity and the more straws being used to draw off the one source, the less for everyone.
Ever have lights dim when heater or you’re A/C kick on? Or have you been in a shower when head loses flow because someone flushes the toilet or turns on water elsewhere in the house?
Now imagine both disruptions of flow as a constant, it’s the same effect that occurs throughout neighborhoods with power and the effect is to all household devices that draw power as shown in photos below.
What can I do?
Always try roasting early before power demand spikes. We know customers who routinely will roast at 6-8 am to avoid these issues or late in the day.
If you have a “Kill A Watt” or similar device that allows you can read the voltage and watch for ideal power situations during the summer months. It’s a highly useful device and can be found on Amazon for about $19.
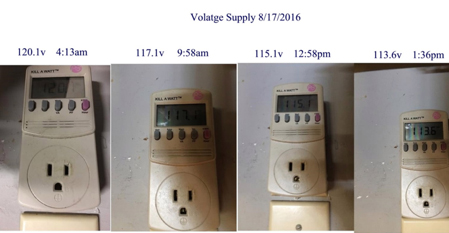
In the image above you can see that depending on the time of day the Kill A Watt reader measures different voltages.
4:13 AM – 120.1 Volts
9:58 AM – 117.1 Volts
12:58 PM – 115.1 Volts
1:36 PM – 113.6 Volts
In this example above the socket is 108 inches from the master panel using a solid 12 gauge copper wire.
The socket has no other power being drawn / empty socket.
No other appliances or devices are on this circuit.
No household appliances or other items are on.
At 2:35 PM the exterior temperatures in the shade were 90F+ and with the A/C on the reading dropped to 109.3 Volts all with no device on this circuit.